Family Leadership Coaches, Consultants, and Educators. Curriculum and Resources for HNW Families and their Advisors.

Clients' Wealth Range
Families Served
Advisors Served
Combined Years Experience
A more human approach to family wealth transfer.
“Legacy Capitals aims to be the leading provider of inheritance and wealth transfer training, coaching, and consulting services for HNW families, family businesses, wealth advisors, and family offices.”
– Dr. Richard Orlando, Founder
Legacy Capitals is an independent boutique firm designed to help financially successful families and their trusted advisors deal with the myriad of “life-impact” issues that come from managing wealth beyond the money itself.

For HNW families, planning for inheritance is more than just a will. We smoothly guide you through the challenges of aligning your values with your estate plan, wealth transfer, preparing your kids, and family business issues. Let us help you make these issues easier to deal with.

All families face successes, conflicts, and transitions impacting wealth and security. As wealth grows, it often magnifies relationship issues among family members, especially children. Our expert guidance and resources lower frustrations and help eliminate unknowns.

HNW Families are faced with special decision points with regard to their children and wealth. We give you the resources and tools drawn from our experience with hundreds of families to help you prepare your family for a more meaningful life - and with more security.

We specialize in helping family enterprises find solutions to special issues and plan for their business & family futures to create legacies that last generations. Let us give you & your family members the skills and tools to protect your business, assets, & relationships.

Our NextGen programs connect young adults together in groups designed to help them reach their goals. Our Groups focus on an array of topics ranging from the technical knowledge needed to effectively manage family wealth, to opportunities to build confidence and reduce feelings of isolation around the unique realities that accompany being part of a financially-successful family.

We use our decades of experience serving families worth tens of millions to many billions to assist in setting up a family giving plan that accounts for all areas of concern: financial, intellectual, social, human, and spiritual.
Stay at the leading edge of the HNW/UHNW industry with continued professional development & ongoing valuable resources for your clients.
"I'm completely bought in on the idea that Whole Family Advising really is the key to retention and acquisition, especially during the big transfer of wealth that's coming. The data speaks for itself.
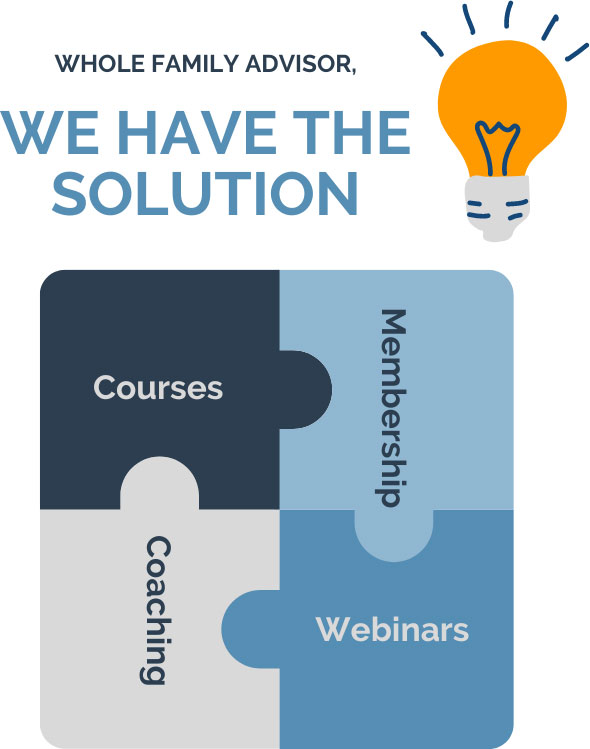
Legacy Capitals provided me with the support and resources to put the Whole Family Advising puzzle together. I am now able to leverage their platform and offerings to expand the value I bring to my client-families."
~ A Whole Family Advisor

We’re trusted partners with wealth and financial advisors offering a range of services and products to help you help expand the value you bring to your client families.
Learn to Serve Multi-Generational Family Needs
Better understand what multi-generational HWN families need from their advisors so you attract and keep them.
Organize and Run Effective Family Meetings
Learn a 10-step process to design family meetings using our Family Meeting Engagement Tool™
Better Understand HNW Client Needs
Many advisors get the value of expanding their service to the whole HNW family, but most cite a lack of confidence or training in the critical skills required.
Provide Value-Added Tools to Your Valued Clients
Leverage our Academy platform to provide highly-valuable videos, tools, and other vital legacy planning content to your family clients.
See what our family and advisor clientele have to say about us.

Legacy Capitals is a leading provider of training, coaching, and consulting services on topics such as wealth & values transfer, preparing the rising generation, family governance, legacy planning, and family philanthropy to financially successful families & family businesses, wealth advisors, family offices, and financial institutions.
© 2024 Legacy Capitals, LLC. All rights reserved. Privacy Policy | Terms Of Use